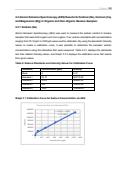
                                P a g e | 23
3.3 Atomic Emission Spectroscopy (AES) Results for Sodium (Na), Calcium (Ca),
and Magnesium (Mg) in Organic and Non-Organic Banana Samples:
3.3.1 Sodium (Na)
Atomic Emission Spectroscopy (AES) was used to measure the sodium content in banana
samples that were both organic and non-organic. Four sodium standards with concentrations
ranging from 78.13 ppb to 1250 ppb were used for calibration. By using the standards' intensity
values to create a calibration curve, it was possible to determine the samples' sodium
concentrations using the intensities that were measured. Table 3.3.1 displays the standards
and their related intensity values, and Graph 3.3.2 displays the calibration curve that results
from given values.
Table 5: Sodium Standards and Intensity Values for Calibration Curve
StandardsConcentration (ppb)Intensity
Blank00.12
Standard 178.13233712.63
Standard 2312.5408820.53
Standard 3625708053.59
Standard 412501252440.07
Graph 3.1 Calibration Curve for Sodium Concentration via AES
Concentration v/s Intensity of Na
1400000
y = 945.97x + 91963
R² = 0.98441200000
Intensity1000000
800000
600000
400000
200000
0
02004006008001000
Concentration (ppb)12001400